
Force Spectroscopy of Bone Proteins
Introduction
Single Molecule Force Spectroscopy with the Atomic Force Microscope, pioneered by the groups of Hermann Gaub and Julio Fernandez, measures the mechanical characteristics of individual molecules, by pulling on individual molecules (assemblies of molecules can also be pulled on). A single molecule force spectroscopy experiment yields a force vs. extension curve, showing the activity of the molecule under the force of the pull as it is extended by the pull. The forces vs. extension curves, also known as pulling curves, are called “molecular fingerprints” of the molecules. Worldwide effort is currently involved in building a library of molecular fingerprints.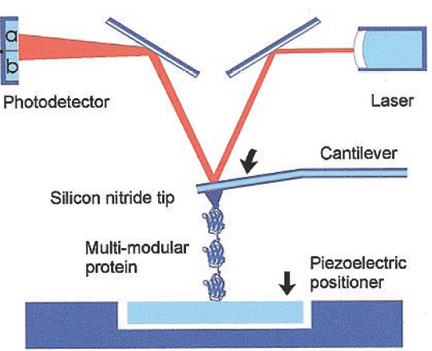
Figure 1 Schematic of basic AFM operation in single-molecule force spectroscopy. When pressed against a layer of protein attached to a substrate, the silicon nitride tip of the AFM cantilever may adsorb a single protein molecule. Extension of the molecule by retraction of the piezoelectric positioner results in deflection of the cantilever. [Oberhauser et al. PNAS (January 2001), Vol. 98 (2): 468-472]. The protein molecule represented here is titin, which consists of folded immunoglobulin domains located along a string..
For molecules with precisely folded domains, such as the muscle protein titin, the fingerprints are simple and step-like (Figure 1). The differences in the curves in Figure 1 due to different pulling rates (made possible by the fast response of small cantilevers) give information here about the potential energy barrier to the forced unfolding of domains (Makarov et al. Kinetic Monte Carlo simulation of titin unfolding. J. Chem. Phys. 114 (2001) 9663-9673).
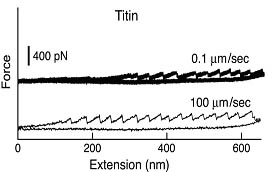
Figure 2 Titin consists of folded immunoglobulin domains located along a string. The drop of the force in this saw-toothed graph takes place when one of the immunoglobulin domains unfolds when titin is pulled. The increase of force, following its collapse, occurs because the unfolded domains are being stretched by the force. [Makarov et al. Journal of Chemical Physics (June 2001) Vol. 114 (21):9663-9673].
For multiple molecules in complex mixtures, the curves become complex, but remain instructive: for example, the curves in Figure 2 of bone molecules show that the forces to extend molecules found in bone increase with the presence of divalent calcium ions in the buffer. (Single molecule force spectroscopy is normally performed in buffers). The force gradually increases and then falls abruptly because of sacrificial bonds and hidden length. There are also techniques for simplifying complex force curves. For example, the extension can be gradually increased on repetitive pulling curves to gradually break shorter polymers and study the longer ones that persist until only one is left.
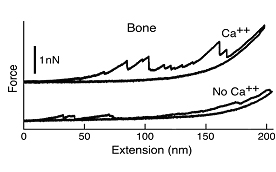
Figure 3 These force vs extension curves of bone molecules demonstrate that the sacrificial bond and hidden length mechanism, which toughens bone by making its molecules harder to break, is dependent on the presence of Ca++ ions. The bone molecule pulled in a buffer with Ca++ ions vs. the bone molecule pulled in a buffer without Ca++ ions took significantly more energy to break. (The area within the curve is a measure of the energy needed to break the molecule).